
Cogeneration Sizing for Economic Success
Summary: This example shows how quickly a Digital Twin can be created using GreenCity and used to evaluate CHP operation in a local district heating network beyond simple annual energy balances. By analysing return temperatures, load profiles and electricity generation, the simulation reveals how improved consumer-side hydraulics and a smaller CHP unit lead to a more robust, efficient and economical system design.
| Scenario | CHP size | Return temperature | Grid purchase | Result |
| A – Initial design | 100 kW | Too high | 212 MWh | CHP cannot operate well |
| B – Hydraulics improved | 100 kW | Acceptable | 148 MWh | Technically better, but oversized |
| C – Final design | 50 kW | Acceptable | 158 MWh | Best solution, optimized for self-consumption |
Designing an efficient local energy system starts with understanding the actual operating conditions on the demand side. For combined heat and power systems, this is especially important because the unit does not only depend on the total heat demand, but also on the temperature level of the return flow of the supply system.
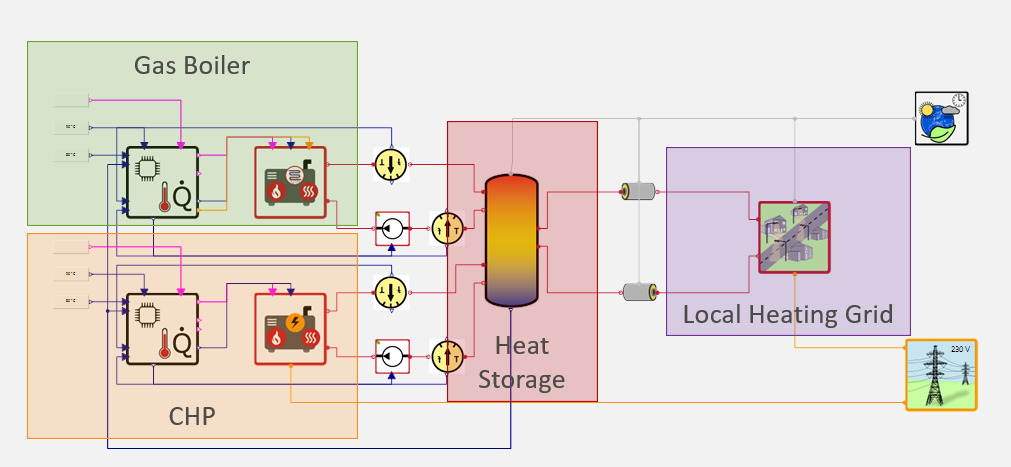
In this example, a Digital Twin is created to represent a small street with several buildings connected to a district heating network. The central supply system consists of a combined heat and power unit and a boiler for peak load coverage.
The first simulation shows that the return temperatures on the consumer side are too high (typical boundary is around 65 to 70 °C for CHPs – see temperature profile at the bottom of the page). As a result, the CHP unit cannot operate as intended, even though it may appear correctly sized when only annual heat demand is considered. Using the GreenCity library, this behaviour can be analysed in detail. Combining buildings, heat demand profiles, electricity demand, network components and supply technologies into one district energy model allows to view the dependency of heat demands, temperature profiles and electricity. This makes it possible to investigate not only how much heat is required, but also whether the temperature conditions allow the CHP unit to run efficiently and reliably. In this project, this problem can be resolved through hydraulic adjustments at the heat consumers.
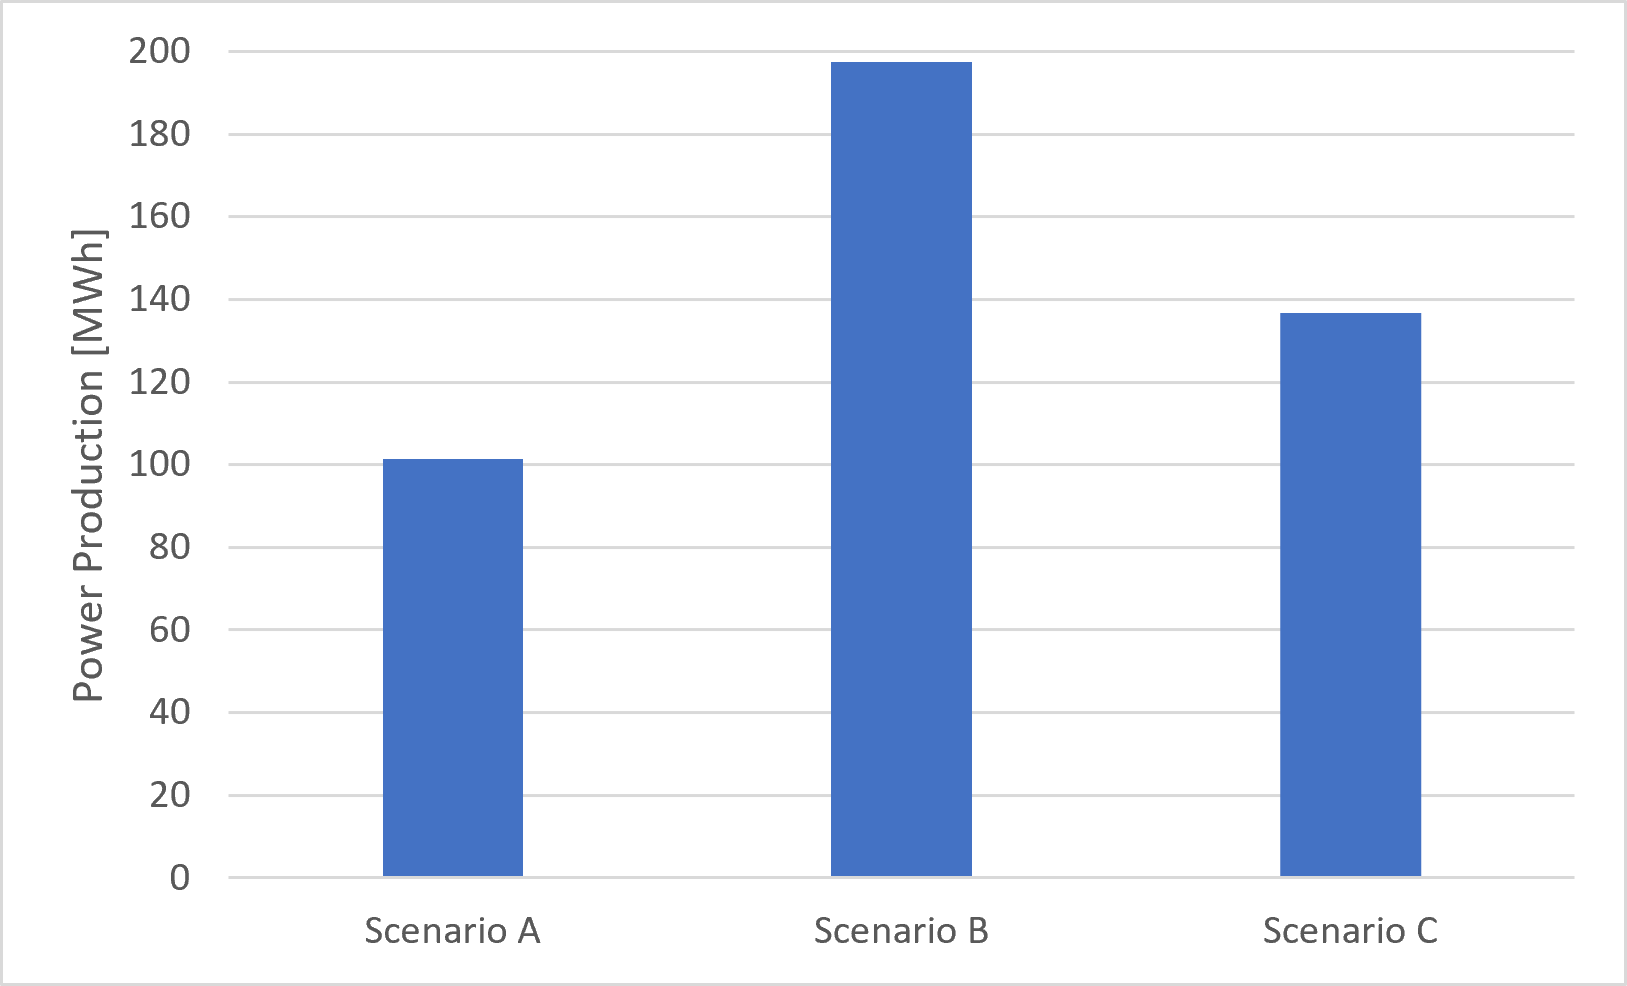
The figure on the left shows the effect of these high return temperatures on the CHP unit. Because the unit is shut down frequently, electricity generation is strongly reduced. After lowering the return temperatures, the CHP can operate for more hours. Even a smaller CHP unit (see next step) can then generate more useful electricity than the larger unit under unfavourable temperature conditions.
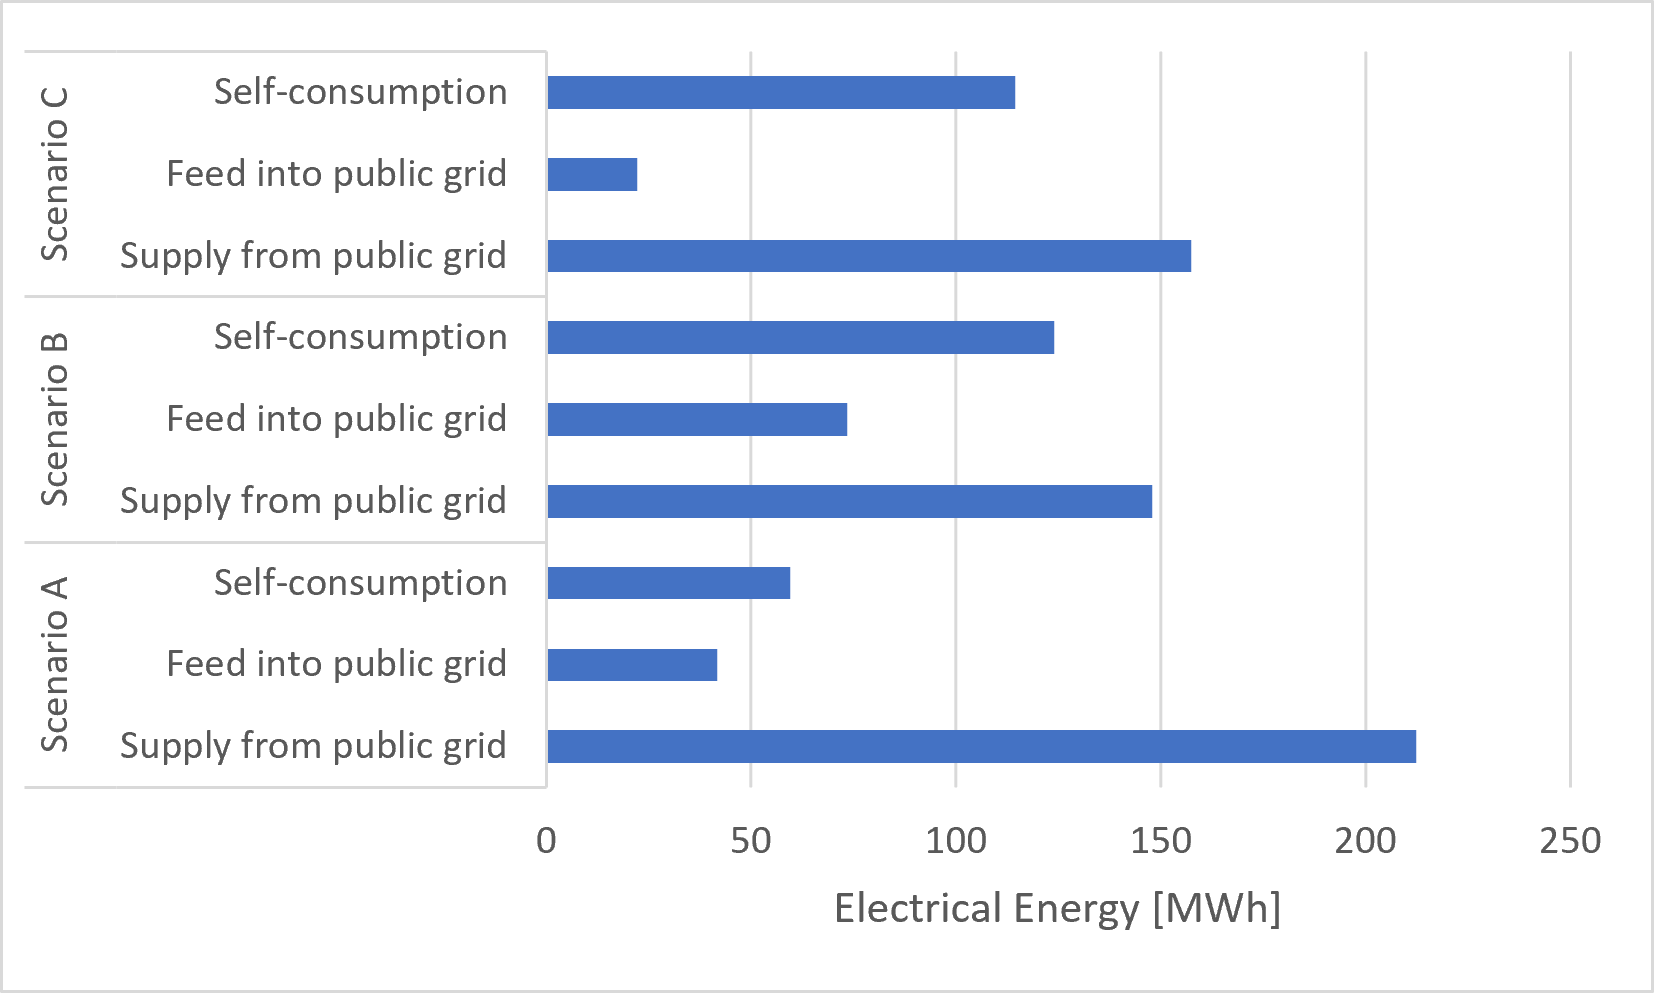
After identifying high return temperatures as the limiting factor and reducing them, the design can be reassessed. To reduce electricity feed into the grid (more than one-third of the produced electrical energy – see figure below), a CHP unit with only half the original heat power can be used. The simulation shows that this smaller CHP unit leads to the same level of electricity purchased from the grid as the previously larger CHP unit operating under unfavourable high-return-temperature conditions (see plot below).
The high return temperatures result in very high electricity consumption from the grid, because the CHP is switched off at a return temperature of above 65 °C. This can be reduced by lowering the return temperatures. With the smaller CHP unit, on the other hand, electricity consumption from the grid is slightly higher, but the amount of electricity fed into the grid is also significantly lower. Because the smaller CHP requires lower investment while maintaining a similar grid-purchase level and reducing excess feed-in, it provides the best overall solution.
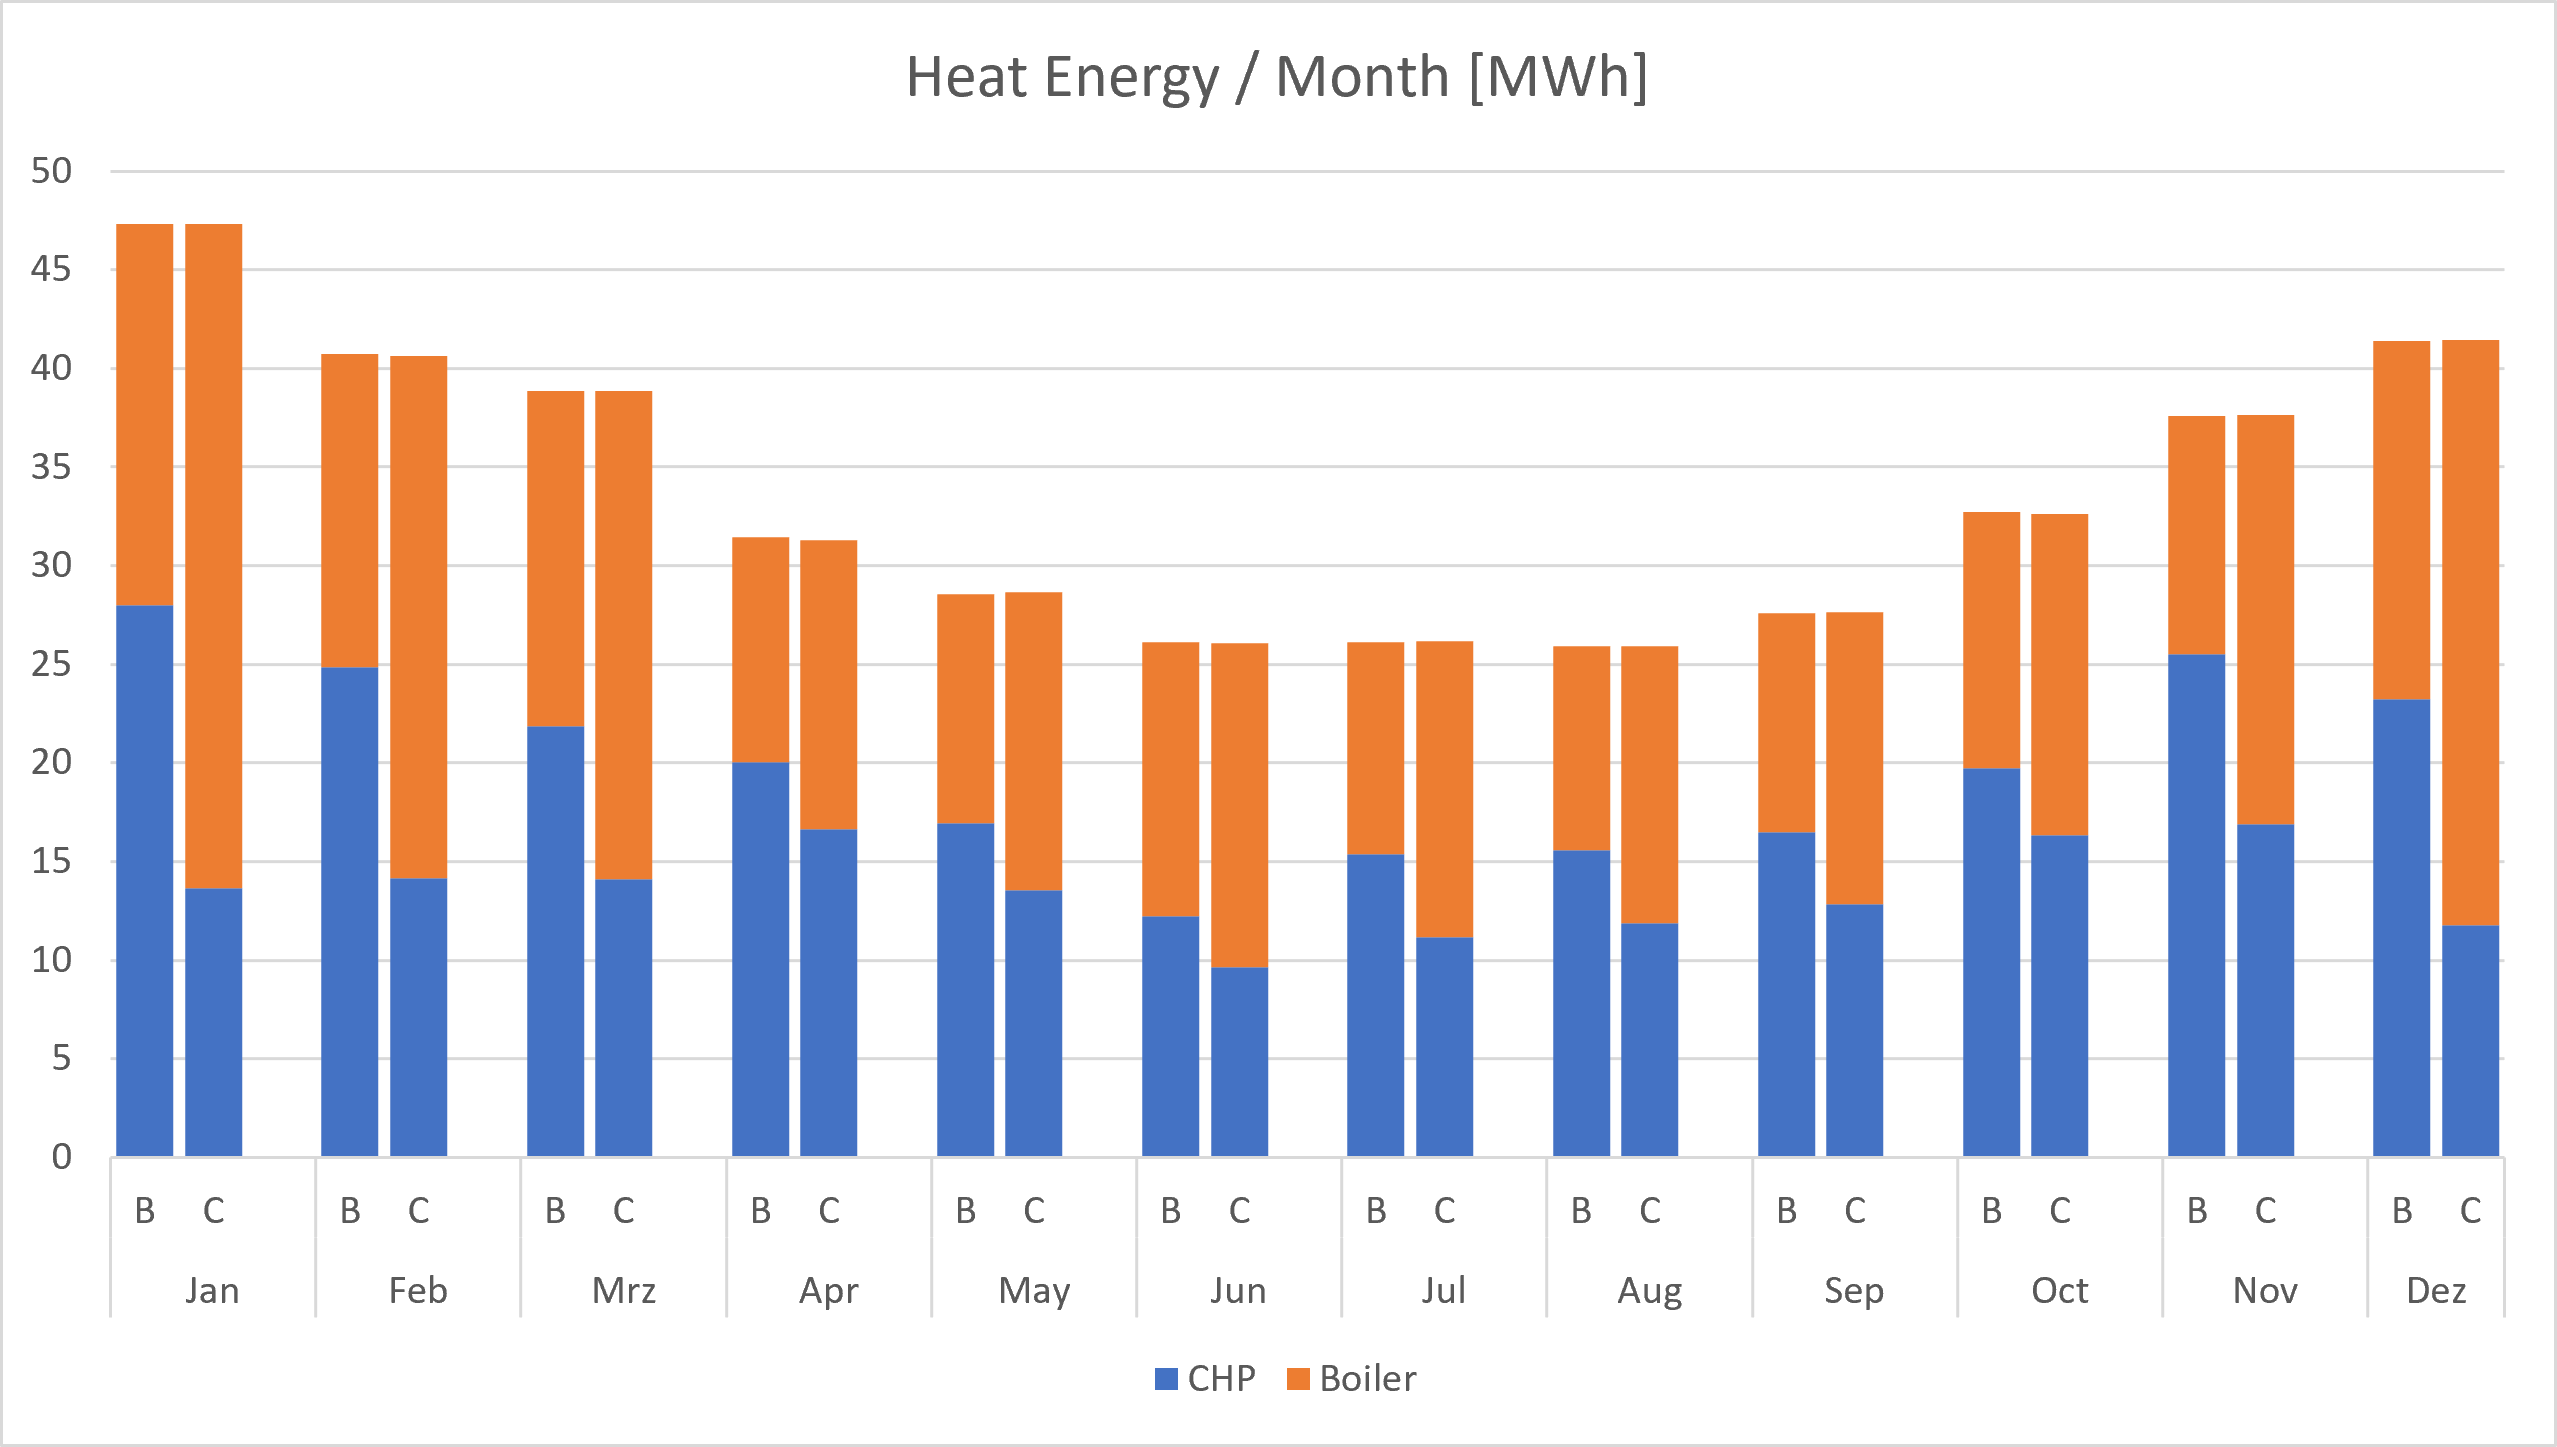
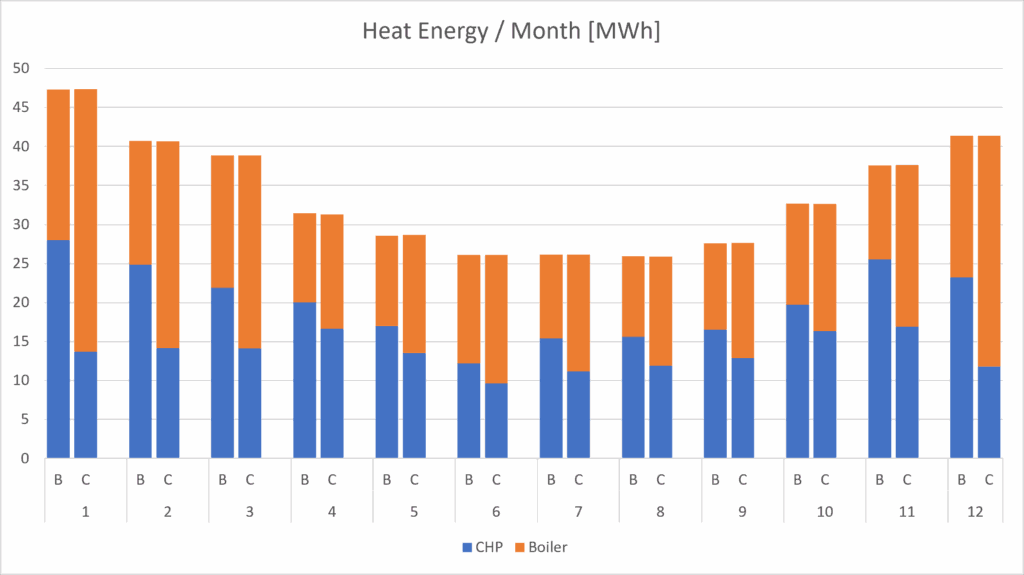
Finally, the load curve is used to evaluate the CHP sizing. The smaller CHP unit fits the summer base load more closely and therefore operates more appropriately over the year. The larger unit is oversized for many operating hours and produces more excess electricity, especially during periods with lower local demand. Therefore, we used the continuous simulation to generate the monthly reports shown on the left.
At the same time, it is evident that the boiler provides more heat when the CHP unit is sized to meet electricity demand, as shown in the figure on the right.
However, this will increase the operating hours of the CHP unit while reducing the frequency of switching operations. This has a positive impact on the service life and maintenance frequency of the CHP unit.
The key benefit of this approach is transparency. Instead of relying only on static annual energy values, the model shows how demand, temperature levels and generation interact over time. Load profiles and load duration curves reveal whether the CHP unit is well matched to the actual operating conditions, whether it is oversized, or whether the consumer-side temperature regime needs to be improved.
For projects involving local heating networks, this type of simulation supports better design decisions from the beginning. By comparing heat demand, electricity demand, return temperatures and possible generation strategies, GreenCity helps identify robust system configurations before detailed engineering begins.
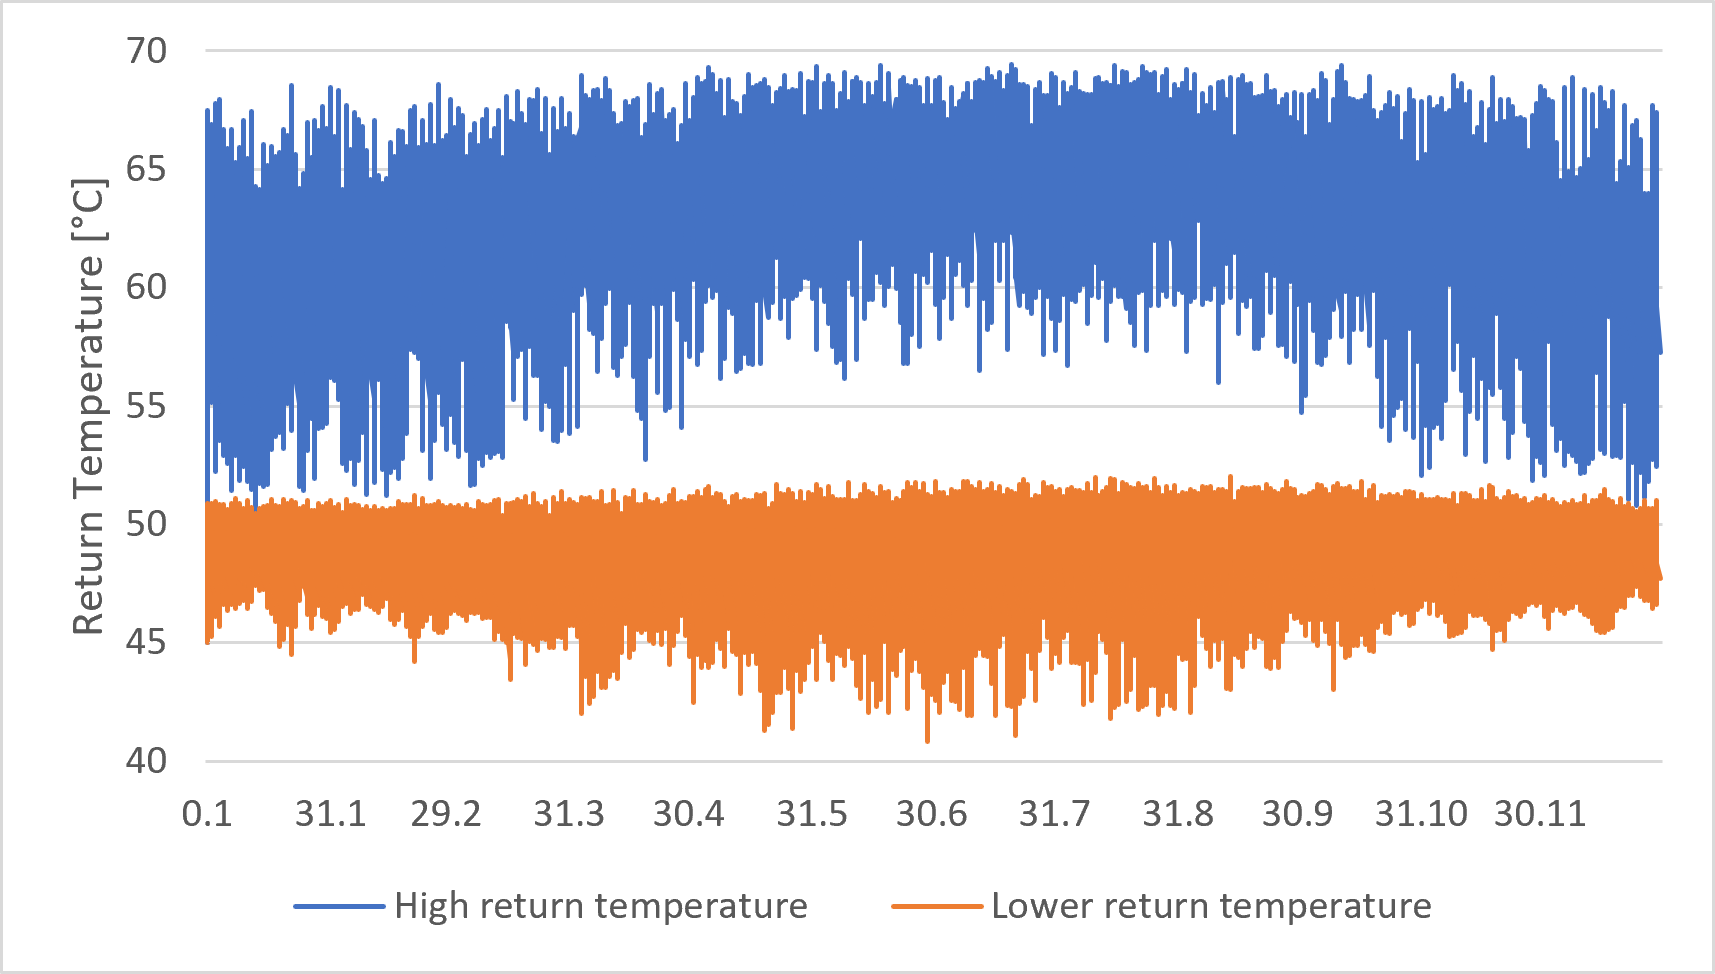
This diagram illustrates that the return temperatures from the consumer side are frequently too high for stable CHP operation. The critical range of approximately 65 to 70 °C is reached especially during summer, when the heat demand is low. This indicates that the main limitation is not the total annual heat demand, but the high return temperatures of the connected consumers.